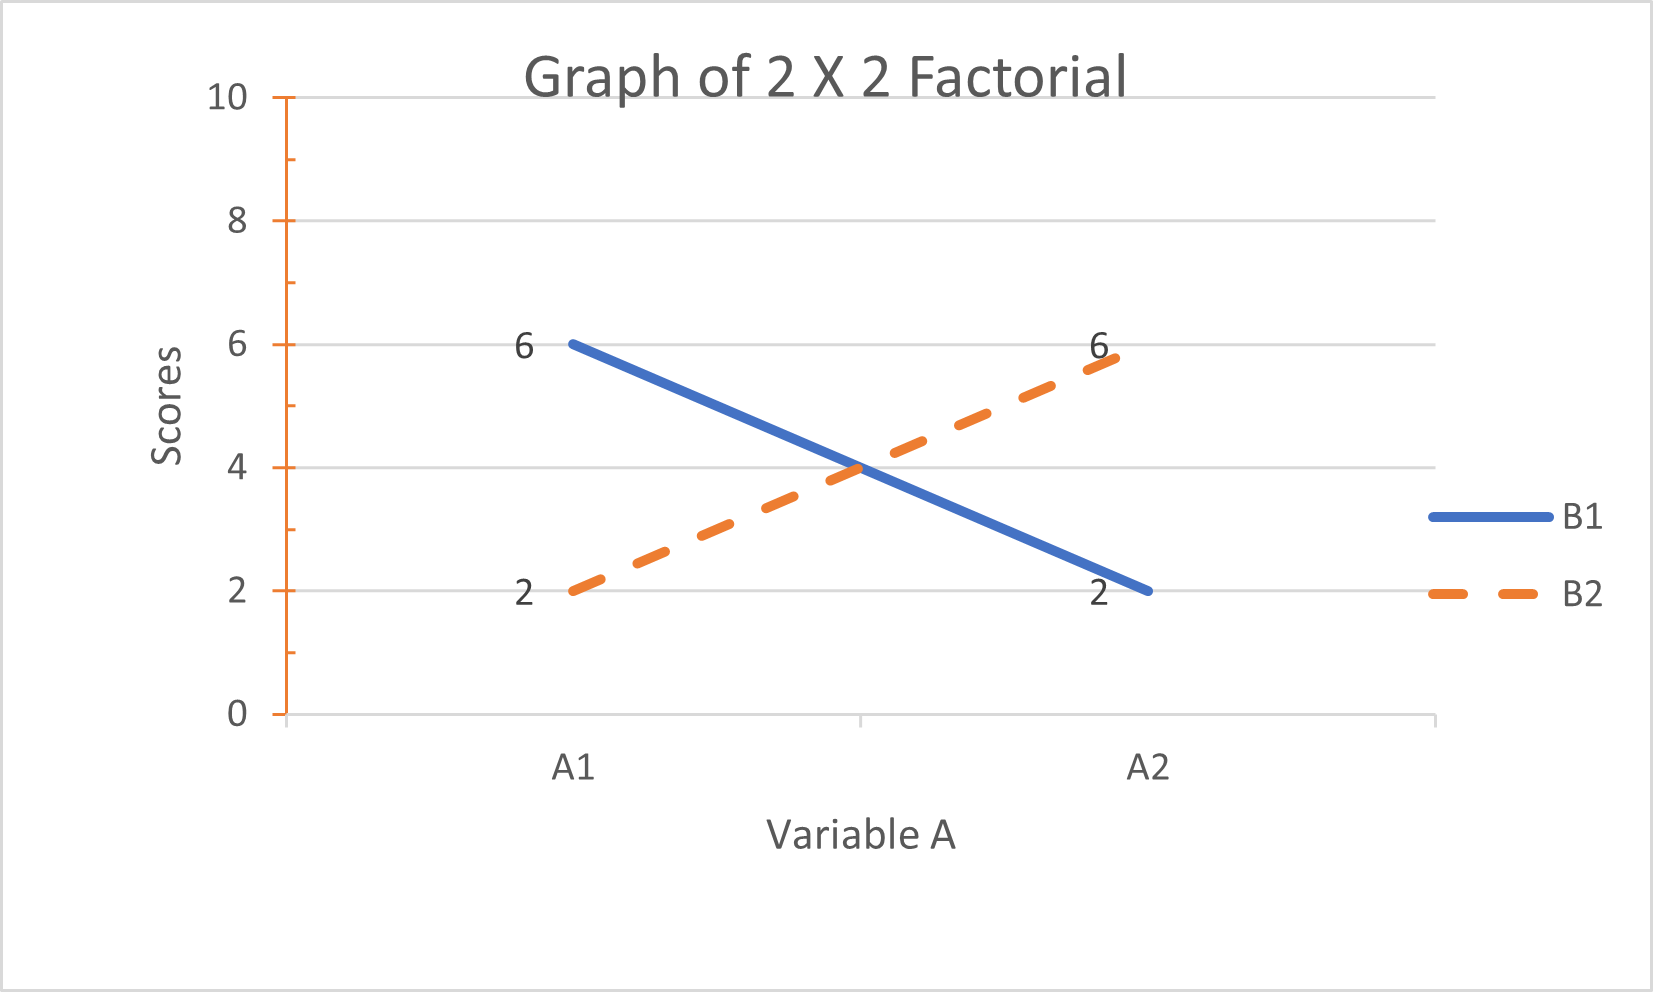
Review of Interpreting Graphs of the Results of 2 X 2 Factorial Experiments

Take this quiz and see how you do. Select the correct answers by using the drop down menus. Once you are done, click submit to see your score! The ones that you get wrong will have a check!

1. Does the graph above depict an interaction?

2. Does the graph above depict an interaction?
3. Does the graph above depict an interaction?
4. Does the graph above depict an interaction?
5. What does the graph above suggest in terms of main effects and interactions?

6. What does the graph above suggest in terms of main effects and interactions?

7.What does the graph above suggest in terms of main effects and interactions?


You got out of correct.

Your Score: %